Feeding Inflation: How President Biden’s Unlawful Food Stamp Expansion is Costing Taxpayers and Consumers Billions
KEY FINDINGS
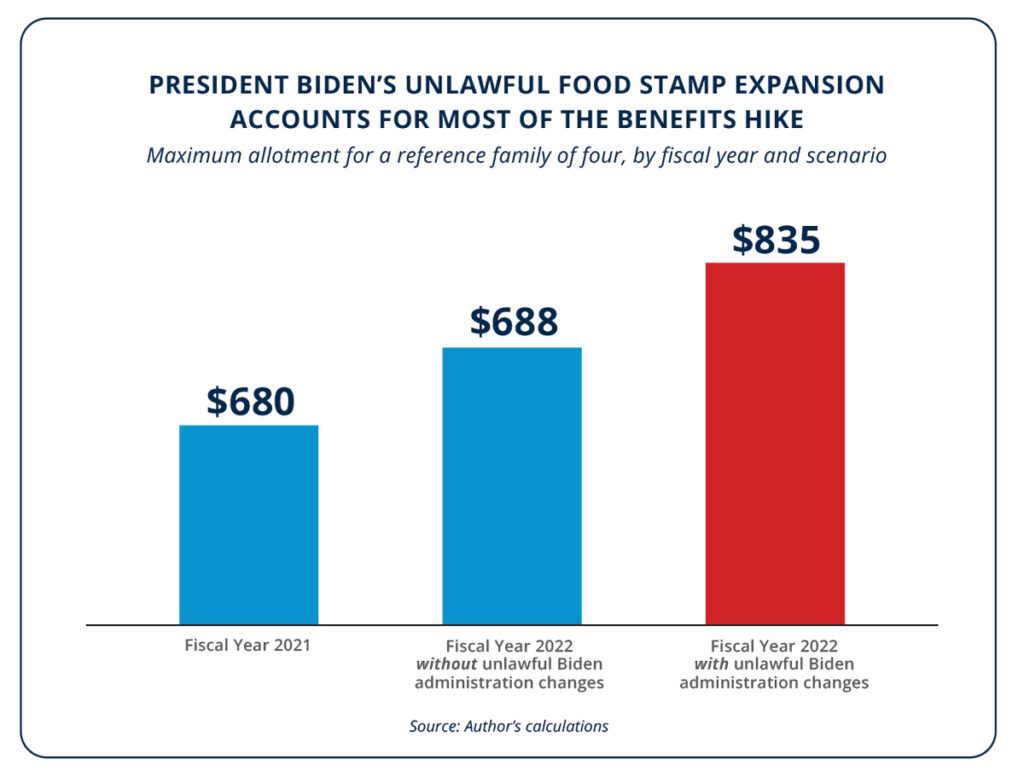
- In 2021, the Biden administration rushed through a 27 percent hike to food stamp benefits—the largest permanent increase in the program’s history.
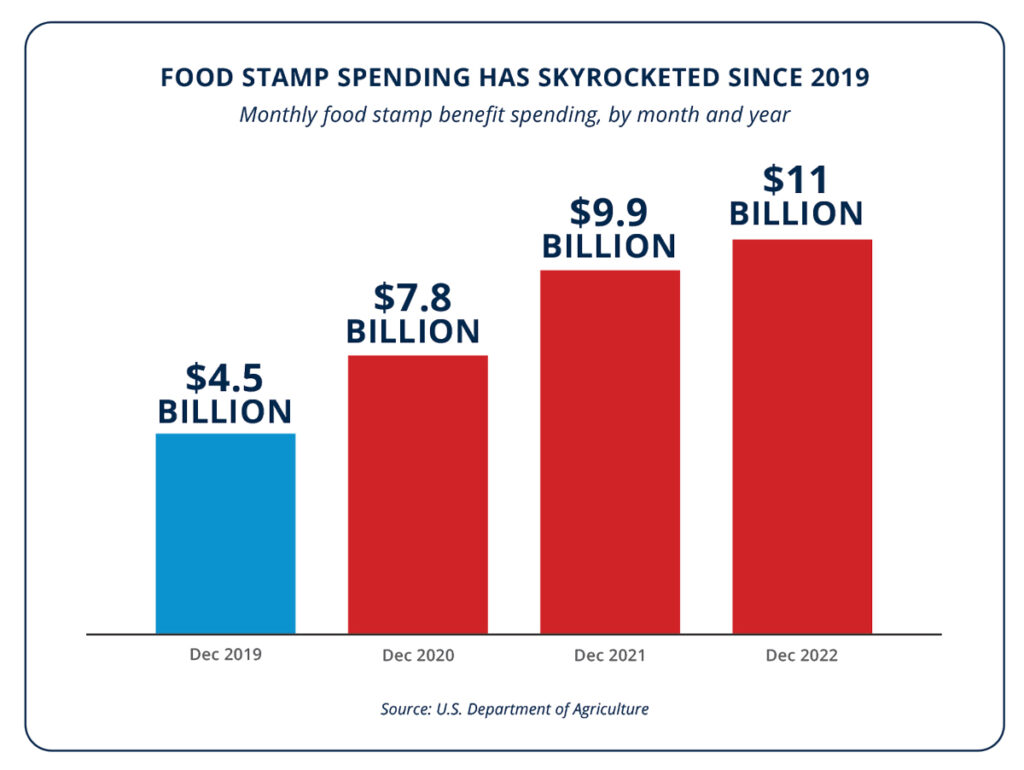
- Monthly food stamp spending more than doubled between 2019 and 2022, reaching record highs.
- Food stamp spending fuels inflation, driving up grocery prices for all Americans.
- Grocery prices have risen by at least 15 percent due to increases in food stamp spending.
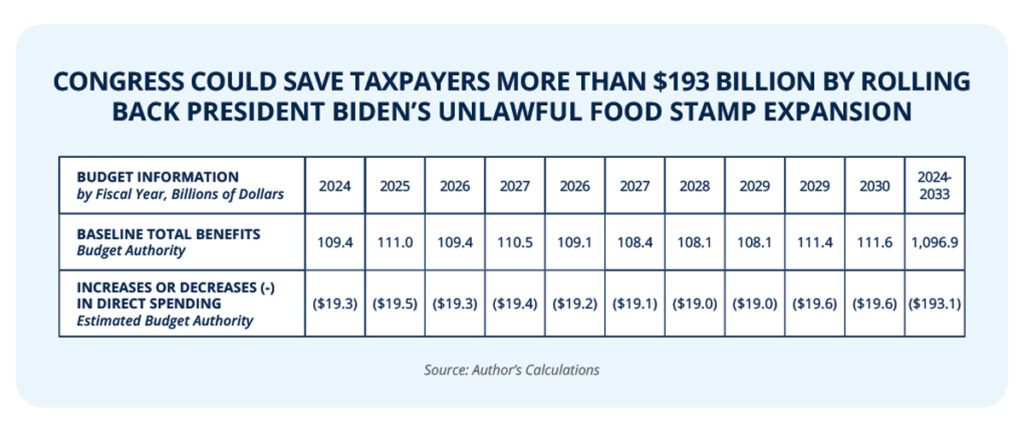
- Congress could save taxpayers more than $193 billion by repealing Biden’s unlawful food stamp expansion.
Overview
In 2021, the Biden administration rushed through the largest permanent increase in food stamp benefits since the program was created, hiking benefits by an average of 27 percent.1 The U.S. Department of Agriculture (USDA) violated internal control standards, canceled formal peer-review processes, and even ignored its chief economist to expedite the expansion.2
This unlawful expansion—which bypassed Congress—will cost taxpayers $250 billion over the next decade and has heavily contributed to soaring grocery prices.3 Congress should repeal President Biden’s unlawful food stamp expansion and ensure this type of executive overreach cannot happen again. In doing so, Congress could save taxpayers more than $193 billion over the next decade.
Food stamp spending has exploded in recent years
Food stamp spending reached a record-high $119 billion in 2022, a sixfold increase over the last two decades, with the vast majority of that growth occurring in the last three years.4-5 In December 2019, for example, taxpayers were spending roughly $4.5 billion per month on food stamp benefits.6 But by December 2022, monthly food stamp spending had skyrocketed to nearly $11 billion.7

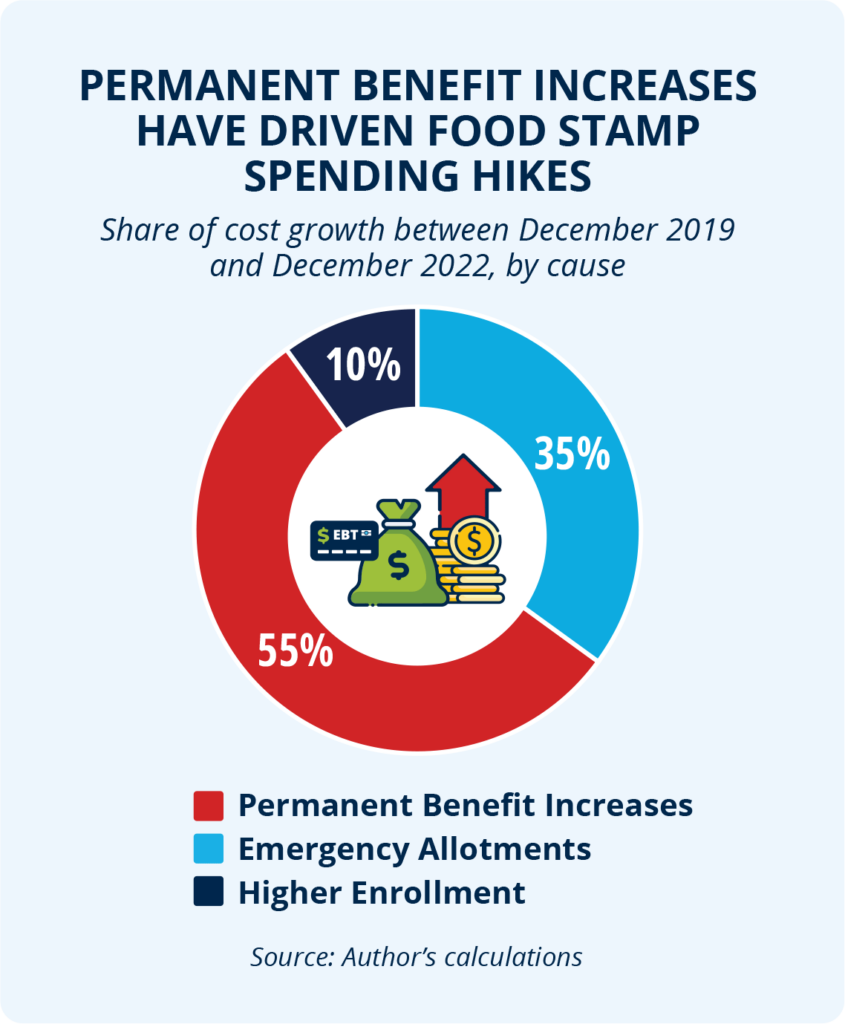
Much of this spending increase stemmed from the federal “emergency allotment” policy—through which all households received the maximum monthly benefit, or more in some cases—while some of the increased food stamp spending is due to higher enrollment levels.8 But most of the higher spending stems from permanent benefit increases driven by USDA officials.9
Thankfully, the emergency allotments expired at the end of February 2023.10 But despite that expiration, food stamp spending remains elevated—sitting at $8.6 billion in March 2023.11 Worse yet, the Congressional Budget Office estimates that food stamp benefits will cost taxpayers nearly $1.1 trillion over the next decade—a record high.12
President Biden’s unlawful food stamp expansion is driving skyrocketing spending
On his first day in office, President Biden appointed Stacy Dean to serve as the Deputy Under Secretary for USDA’s Food, Nutrition, and Consumer Services, the agency that oversees the food stamp program.13 In 2022, he nominated her for promotion to Under Secretary, though she has yet to be confirmed by the
U.S. Senate.14

Before joining the Biden administration, Ms. Dean worked in the Clinton administration and at the far-left Center on Budget and Policy Priorities, where she spent years lobbying for food stamp expansions—including proposals to increase food stamp benefits by changing the Thrifty Food Plan.15 Having failed to get congressional approval to increase food stamp benefits, Ms. Dean and bureaucrats under her direction moved forward with a plan to unilaterally expand the program through a backdoor: reevaluating the Thrifty Food Plan.16
Ultimately, this pet project turned into the single largest food stamp expansion in the history of the program, expanding benefits by an average of 27 percent in 2022.17 This expansion will cost taxpayers up to $250 billion over the next decade, assuming bureaucrats do not unilaterally and unlawfully expand benefits again during the next reevaluation.18
Between June 2020 and May 2021, USDA reported that the cost of the Thrifty Food Plan grew by just one percent—in line with growth for the other food cost plans.19-21 But USDA changed the Thrifty Food Plan entirely for June 2021, giving it a single-month jump of more than 21 percent—the equivalent of a 932 percent annual inflation rate.22-24
Although food stamp benefits would have risen somewhat due to inflation, 95 percent of the 2021 changes were the direct result of President Biden’s unlawful changes to the Thrifty Food Plan.25

USDA cooked the books to expand food stamps
In her quest to rush through this massive welfare expansion, Ms. Dean and others in USDA leadership abandoned the department’s 45-year cost neutrality requirement, violated internal control standards, canceled formal peer-review processes, ignored the department’s chief economist, and forced the reevaluation team to cut corners and ignore best practices to meet Ms. Dean’s accelerated timeline.26
Although federal law requires agencies to submit reports on proposed rule changes to Congress and the Government Accountability Office (GAO) before they become effective, USDA withheld this information and unlawfully implemented the change before Congress could review and vote on it.27 By the time GAO was able to review the matter in July 2022, USDA had already paid out billions of dollars in benefit increases.28
Food stamp spending increases drive up inflation
Taxpayer spending on food stamps contributes to higher inflation, leading to higher grocery prices for all. Researchers at the World Bank reviewed more than a decade of retail scanner data before and after the Great Recession to measure the impact food stamp spending has on food prices.29 Their review included 2.6 million barcodes with data from more than 20,000 stores, comprising roughly half of all sales at U.S. grocery stores.30
That research found that a one percent increase in per-capita food stamp benefits increased grocery store prices by 0.08 percent.31 Put another way: Food prices increase by one percent for every 12.5 percent increase in food stamp spending.
Between December 2019 and March 2023, food prices grew by a staggering 23 to 24 percent.32-35 Some grocery prices have risen even faster. The price of margarine, for example, has grown by more than 59 percent, egg prices have skyrocketed by 54 percent, and frozen vegetables now cost nearly 36 percent more than they did in 2019.36-39
Food stamp spending hikes could account for at least two-thirds of that increase.40 Per-capita food stamp spending grew by more than 90 percent between December 2019 and March 2023—even after the pandemic-related emergency allotments expired.41-43 After accounting for emergency allotments and pandemic EBT programs, total food stamp spending had nearly tripled while those programs were in effect.44 This suggests food stamp spending increases fueled grocery price increases of more than 15 percent.45-46
Repealing President Biden’s unlawful food stamp expansion would save taxpayers more than $193 billion
Food stamp spending is projected to cost taxpayers more than $1 trillion over the next decade.47 Rolling back President Biden’s unlawful food stamp expansion could provide significant relief for taxpayers, saving $193 billion over that same budget window.48-50

THE BOTTOM LINE: Congress should repeal President Biden’s unlawful food stamp expansion and require congressional approval for all future costly executive actions.
Congress should repeal President Biden’s unlawful food stamp expansion and codify a statutory requirement that all Thrifty Food Plan reevaluations be cost neutral to prevent future bureaucrats from engaging in the same lawless behavior. By rolling back President Biden’s food stamp expansion, Congress could save taxpayers more than $193 billion over the next decade. Likewise, Congress should require that bureaucrats receive congressional approval for all costly executive actions before those actions take effect.

References
1 Jonathan Ingram and Hayden Dublois, “President Biden unilaterally and unlawfully increased food stamp benefits,” Foundation for Government Accountability (2023), https://thefga.org/research/president-biden-increased-food-stamp-benefits.
2 Ibid.
3 Ibid.
4 Author’s calculations based upon data provided by the U.S. Department of Agriculture on total food stamp expenditures between fiscal years 2002 and 2022. See, e.g., Food and Nutrition Service, “SNAP monthly state participation and benefit summary,” U.S. Department of Agriculture (2023), https://www.fns.usda.gov/sites/default/files/resource-files/SNAPZip69throughCurrent-4.zip.
5 Approximately $59.1 billion of the $98.8 billion in in food stamp spending growth since fiscal year 2002 has occurred since fiscal year 2019.
6 Food and Nutrition Service, “SNAP monthly state participation and benefit summary,” U.S. Department of Agriculture (2023), https://www.fns.usda.gov/sites/default/files/resource-files/SNAPZip69throughCurrent-4.zip.
7 Ibid.
8 Author’s calculations based upon data provided by the U.S. Department of Agriculture on food stamp enrollment, total expenditures, and monthly allotment expenditures, disaggregated by state, month, and fiscal year.
9 Approximately 54.8 percent of the annualized cost growth between December 2019 and December 2022 was caused by permanent benefit increases, compared to 35.2 percent caused by emergency allotments, and 10.0 percent caused by higher enrollment.
10 Hayden Dublois, “Food stamp boosts are bankrupting taxpayers,” Foundation for Government Accountability (2023), https://thefga.org/research/food-stamp-boosts-are-bankrupting-taxpayers.
11 Food and Nutrition Service, “SNAP monthly state participation and benefit summary,” U.S. Department of Agriculture (2023), https://www.fns.usda.gov/sites/default/files/resource-files/SNAPZip69throughCurrent-4.zip.
12 Congressional Budget Office, “Supplemental Nutrition Assistance Program,” Congressional Budget Office (2023), https://www.cbo.gov/system/files/2023-05/51312-2023-05-snap.pdf.
13 Jonathan Ingram and Hayden Dublois, “President Biden unilaterally and unlawfully increased food stamp benefits,” Foundation for Government Accountability (2023), https://thefga.org/research/president-biden-increased-food-stamp-benefits.
14 Ibid.
15 Ibid.
16 Ibid.
17 Ibid.
18 Ibid.
19 Author’s calculations based upon data provided by the U.S. Department of Agriculture on the monthly cost of the Thrifty Food Plan, Low Cost Plan, and Moderate Cost Plan for a reference family of four between June 2020 and May 2021.
20 Food and Nutrition Service, “Official USDA food plans: Cost of food at home at four levels, U.S. average, June 2020,” U.S. Department of Agriculture (2020), https://fns-prod.azureedge.us/sites/default/files/media/file/CostofFoodJun2020.pdf.
21 Food and Nutrition Service, “Official USDA food plans: Cost of food at home at four levels, U.S. average, May 2021,” U.S. Department of Agriculture (2021), https://fns-prod.azureedge.us/sites/default/files/media/file/CostofFoodMay2021.pdf.
22 Author’s calculations based upon data provided by the U.S. Department of Agriculture on the monthly cost of the Thrifty Food Plan for a reference family of four between May 2021 and June 2021.
23 Food and Nutrition Service, “Official USDA food plans: Cost of food at home at four levels, U.S. average, May 2021,” U.S. Department of Agriculture (2021), https://fns-prod.azureedge.us/sites/default/files/media/file/CostofFoodMay2021.pdf.
24 Food and Nutrition Service, “Thrifty Food Plan, 2021,” U.S. Department of Agriculture (2021), https://fns-prod.azureedge.us/sites/default/files/resource-files/TFP2021.pdf.
25 Author’s calculations based upon data provided by the U.S. Department of Agriculture on the cost of the Thrifty Food Plan, Low Cost Plan, and Moderate Cost Plan between June 2020 and May 2021, and the cost of the Low Cost Plan and Moderate Cost Plan between May 2021 and June 2021.
26 Jonathan Ingram and Hayden Dublois, “President Biden unilaterally and unlawfully increased food stamp benefits,” Foundation for Government Accountability (2023), https://thefga.org/research/president-biden-increased-food-stamp-benefits.
27 Ibid.
28 Ibid.
29 Justin H. Leung and Hee Kwon Seo, “How do government transfer payments affect retail prices and welfare? Evidence from SNAP,” Journal of Public Economics (2023), https://www.sciencedirect.com/science/article/abs/pii/S0047272722001621.
30 Ibid.
31 Ibid.
32 Author’s calculations based upon data provided by the U.S. Department of Labor on the change in the consumer price index for food and for food at home between December 2019 and March 2023, and data provided by the U.S. Department of Commerce on the change in the personal consumption expenditure index for food and beverages purchased for off-premises consumption between the fourth quarter of 2019 and the first quarter of 2023.
33 The consumer price index for food grew by approximately 24.3 percent between December 2019 and March 2023. See, e.g., Bureau of Labor Statistics, “Consumer price index for urban consumers: Food,” U.S. Department of Labor (2023), https://data.bls.gov/timeseries/CUSR0000SAF1.
34 The consumer price index for food at home grew by approximately 23.2 percent between December 2019 and March 2023. See, e.g., Bureau of Labor Statistics, “Consumer price index for urban consumers: Food at home,” U.S. Department of Labor (2023), https://data.bls.gov/timeseries/CUSR0000SAF11.
35 The personal consumption expenditure index for food and beverages purchased for off-premises consumption grew by approximately 23.1 percent between the fourth quarter of 2019 and the first quarter of 2023. See, e.g., Bureau of Economic Analysis, “National income and product accounts: Price indexes for personal consumption expenditures by major type of product,” U.S. Department of Commerce (2023), https://apps.bea.gov/iTable/?reqid=19&step=3&isuri=1&nipa_table_list=64&categories=survey#eyJhcHBpZCI6MTksInN0ZXBzIjpbMSwyLDMsM10sImRhdGEiOltbIm5pcGFfdGFibGVfbGlzdCIsIjY0Il0sWyJjYXRlZ29yaWVzIiwiU3VydmV5Il0sWyJGaXJzdF9ZZWFyIiwiMjAxOSJdLFsiTGFzdF9ZZWFyIiwiMjAyMyJdLFsiU2NhbGUiLCIwIl0sWyJTZXJpZXMiLCJRIl1dfQ==.
36 Author’s calculations based upon data provided by the U.S. Department of Labor on the change in the consumer price index for specific food types between December 2019 and March 2023.
37 Bureau of Labor Statistics, “Consumer price index for urban consumers: Margarine,” U.S. Department of Labor (2023), https://data.bls.gov/timeseries/CUSR0000SS16011.
38 Bureau of Labor Statistics, “Consumer price index for urban consumers: Eggs,” U.S. Department of Labor (2023), https://data.bls.gov/timeseries/CUSR0000SEFH.
39 Bureau of Labor Statistics, “Consumer price index for urban consumers: Frozen vegetables,” U.S. Department of Labor (2023), https://data.bls.gov/timeseries/CUSR0000SS14011.
40 Author’s calculations based upon the results of the proprietary microsimulation model that incorporates data on monthly food stamp enrollment and expenditures between 2019 and 2023 provided by the U.S. Department of Agriculture, data on monthly resident population totals provided by the U.S. Department of Commerce, and estimates of the impact on grocery prices for each percentage point increase in per capita food stamp spending provided by the World Bank.
41 Author’s calculations based upon data provided by the U.S. Department of Agriculture on monthly food stamp expenditures and data provided by the U.S. Department of Commerce on monthly resident population.
42 Food and Nutrition Service, “SNAP monthly state participation and benefit summary,” U.S. Department of Agriculture (2023), https://www.fns.usda.gov/sites/default/files/resource-files/SNAPZip69throughCurrent-4.zip.
43 Bureau of Economic Research, “Population,” U.S. Department of Commerce (2023), https://fred.stlouisfed.org/series/POPTHM.
44 Author’s calculations based upon data provided by the U.S. Department of Agriculture on monthly food stamp expenditures, emergency allotment expenditures, and pandemic EBT expenditures.
45 Ibid.
46 Author’s calculations based upon the results of the proprietary microsimulation model that incorporates data on monthly food stamp enrollment and expenditures between 2019 and 2023 provided by the U.S. Department of Agriculture, data on monthly resident population totals provided by the U.S. Department of Commerce, and estimates of the impact on grocery prices for each percentage point increase in per capita food stamp spending provided by the World Bank.
47 Congressional Budget Office, “Supplemental Nutrition Assistance Program,” Congressional Budget Office (2023), https://www.cbo.gov/system/files/2023-05/51312-2023-05-snap.pdf.
48 Author’s calculations based upon data provided by a proprietary microsimulation model estimating the expenditure effect of eliminating the June 2021 Thrifty Food Plan reevaluation and returning to a cost-neutral June 2020 Thrifty Food Plan adjusted for inflation.
49 Actual changes in the Thrifty Food Plan between June 2020 and May 2021, the Low Cost Plan between June 2020 and June 2021, and the Moderate Cost Plan between June 2020 and June 2021 were used to reconstruct where the Thrifty Food Plan would have been set in June 2021 absent USDA’s unlawful changes. Changes in the Thrifty Food Plan, Low Cost Plan, and Moderate Cost Plan since June 2021 were used to construct growth rates to fiscal year 2023.
50 Projected changes in total enrollment and in inflation for the Thrifty Food Plan for fiscal years 2024 through 2033 were derived from data provided by the Congressional Budget Office. See, e.g., Congressional Budget Office, “Supplemental Nutrition Assistance Program,” Congressional Budget Office (2023), https://www.cbo.gov/system/files/2023-05/51312-2023-05-snap.pdf.
